Create Account

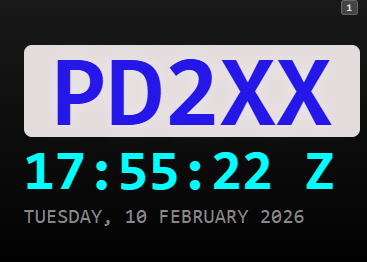
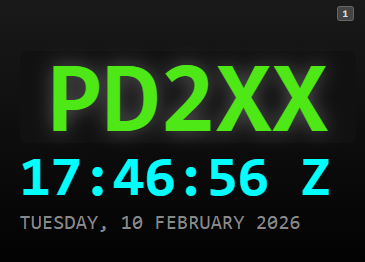
Box 1: Station Information & Display
This section serves as your primary header and contains the essential identity and timing data for your station.
Display Elements
· Station Name: Displays your unique station identifier or callsign.
· GMT Time: Provides the current Greenwich Mean Time for global synchronization.
· Current Date: Displays the active calendar date.
Customization Options
You can modify the visual appearance of this box within the Config Menu:
· Callsign Color: Change the hex code or color of the text for your station name.
· Background Color: Adjust the solid color or highlight behind your callsign for better visibility or branding.
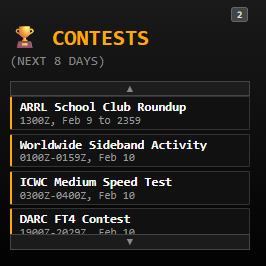
Box2: Event en Contest
This section provides the specific timing details for active contests or special event station activations.
Key Schedule Data
· Activation Date: Displays the exactly start date of the special event or contest.
· Activation Time: Shows the exact commencement time (typically in UTC/GMT) for the event.
· Event Details: Provides the name or description of the specific contest currently being tracked
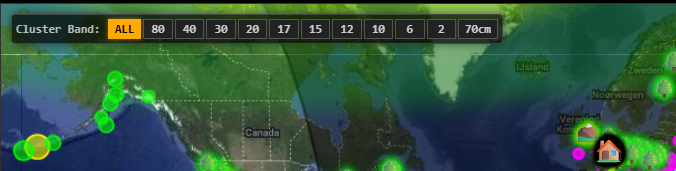
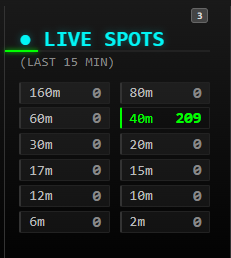
Box 3: Live Spots & Propagation Map
This module provides real-time visualization of your signal’s reach across all supported amateur radio bands.
· Band Filtering & Customization
To help you focus on the frequencies your equipment is currently tuned for, you can filter the list:
· Accessing the Menu: Click the downward arrow at the bottom of the box to expand the band selector.
· Selection Options: * ALL: View spots across all amateur bands. · Specific Bands: Specify a single band (such as 160, 80, 60, 40, 30, 20, 17, 15, 12 or 10 meters) to filter the results.
· Visual Indicators: The currently selected filter is highlighted in orange, making it easy to identify your active settings at a glance Reception Statistics
· Multi-Band Support: Monitor activity across the entire spectrum simultaneously.
· Listener Count: See exactly how many stations worldwide have picked up your signal in real-time.
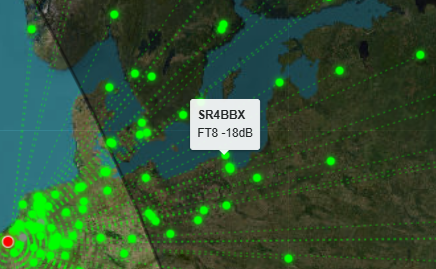
Interactive Visual Map The integrated map offers a geographical representation of your performance:
· Lines & Dots: Visualize propagation paths (lines) connecting your location to the receiving stations (dots).
· Station Data: Click on any spot to reveal detailed telemetry, including:
· Operating Mode: (e.g., FT8, FT4).
· Signal Strength: Measured in dB to gauge your signal-to-noise ratio. Smart Color Coding To ensure high-speed readability during busy contests:
· Band-Specific Colors: Each band is assigned a unique color, allowing you to instantly identify which band a spot belongs to and where your signal is performing best at a glance..
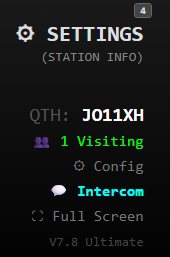
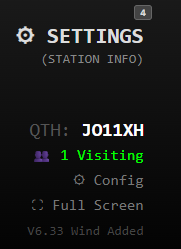
Box 4: Station Identity & Interface Settings
This box acts as the Identity Hub and Layout Controller. It manages how your station is identified on the air and how the interface appears on your screen.
Station Identity
· Callsign: Displays your oicial operating license identifier.
· Grid Square: Shows your Maidenhead locator (e.g., JO21xx) for accurate distance and bearing calculations.
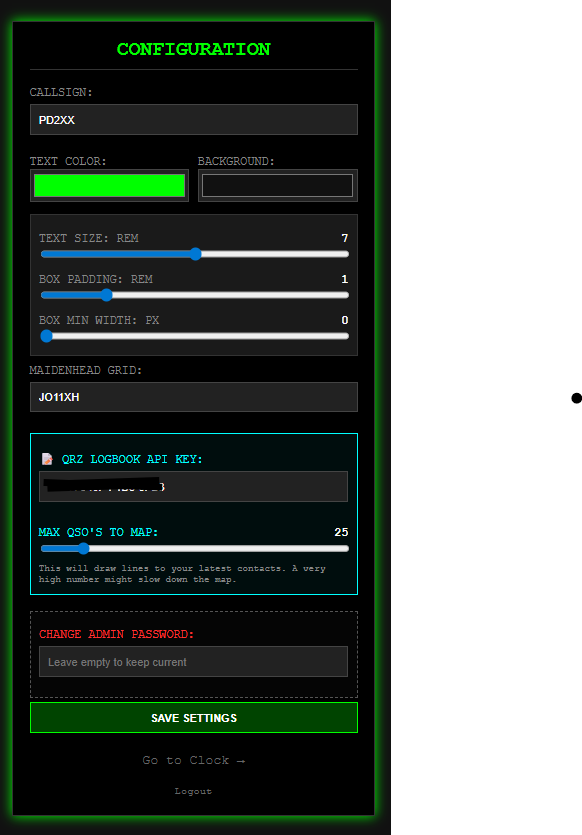
Visual Customization you can tailor the UI to fit your monitor size or personal preference:
· Callsign Styling: Customize both the text color and the background highlight for your callsign.
· Typography: Adjust the font size for better readability.
· Layout Geometry: Modify the width of the boxes to optimize your screen real estate. System Security & Persistence
· Apikey QRZ: fill in your QRZ api-key, and with the bar you can change how many last qso’ss you want to see (0-200).
· Admin Password: You can update your administrative password directly within this box to ensure performance and security.
· Update Persistence: The password is stored in a dedicated configuration file. This means your custom password remains active even after software updates you won’t need to reset it manually.
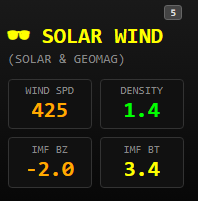
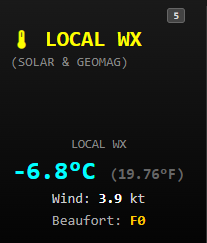
Box 5: Space Weather X
This module provides comprehensive, real-time data on solar activity and geomagnetic
conditions, essential for predicting radio propagation.
Real-Time Solar & Geomagnetic Indices
Monitor the primary factors aecting the ionosphere:
· Solar Flux: Current SFI levels.
· Sunspots: Active sunspot counts.
· A & K Indices: Real-time geomagnetic stability and storm levels.NASA SDO Live Feed (Solar Dynamics Observatory)
View high-definition, live imagery of the sun directly from NASA. You can toggle between diferent wavelengths to observe various solar phenomena: Selection View Type Best for Observing… Gold Corona High-temperature solar atmosphere.
Red Chromosphere Solar flares and prominences.
Bronze Quiet Corona Stable regions of the solar atmosphere.
Teal Flaring Active solar flares and X-ray activity.
Original Sunspots Visible magnetic disturbances on the solar surface.
Local Weather Integration
This box serves a dual purpose. By clicking anywhere on the map interface, the system will overlay Local Weather Information for that specific geographic coordinate.
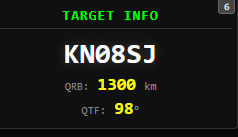
Box 6: Target Info (Locator & Distance)
This module provides instant geographical data between your station and any point you select on the global map.
· Maidenhead Locator: When you click anywhere on the map, the target’s 6-character grid locator (e.g., KN08SJ or KO59CT) is instantly displayed in large, clear text.
· Visual Confirmation: This allows you to quickly verify the exact location of a distant station or a specific spot of interest
Path Calculations (Q-Codes)
The system automatically calculates the vital statistics for your antenna aiming and signal propagation:
· QRB (Distance): Displays how far approximately the target is from your home station, measured in kilometers (km).
· QTF (Bearing): Provides the precise compass heading in degrees (°) from your station to the target. This tells you exactly where to point your beam or directional antenna to reach that specific locator.Target Identificationpot of interest.
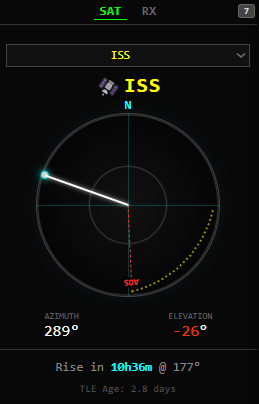
Box 7: Satellite Tracking & Radar
This module provides a high-precision radar view and orbital data for tracking amateur radio satellites and the International Space Station (ISS).
Real-Time Radar Display
The central radar screen gives you a visual representation of a satellite’s position relative to your station:
· Azimuth (Direction): Shown by the white line and glowing indicator, representing the compass heading (e.g., 289°).
· Elevation: Indicates the height of the satellite above the horizon. Negative values (e.g., -26°) signify the satellite is currently below the horizon.
· Acquisition of Signal (AOS): The red dashed line marked “AOS” indicates the point at which the satellite will first become reachable.
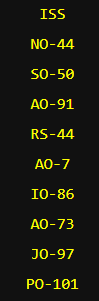
Satellite Selection & Lists
· Active Selector: Use the dropdown menu or the vertical list (showing satellites like ISS, NO-44, SO-50, etc.) to switch targets instantly.
· Top-Box Integration: Clicking a satellite in the list automatically updates the detailed telemetry in the top display box for near real-time monitoring.
Pass Predictions & Data
· Rise Time: The footer provides a countdown to the next pass (e.g., Rise in 10h 36m)
and the specific heading (177°) where it will appear.
· TLE Age: Displays the age of the Two-Line Element data to ensure your tracking calculations are based on the latest orbital updates.
If you click in box 7 at bcn HF beacon network shows up.!
Option 1: Clear & Professional (Best for a website)
· We have integrated a worldwide HF beacon network. Operators can now monitor signals across multiple bands to identify real
time propagation openings.
Option 2: Short & Direct (Best for a feature list)
· Global HF Beacons: Track worldwide signals to detect band openings instantly.”
Option 3: Engaging (Best for a newsletter or social media)
· Check the bands at a glance! We’ve added global HF beacons so you can see exactly when and where the bands are opening up.”
Option 4: Technical (Best for a manual or technical update)
· Worldwide HF beacon integration now active. Use this tool to monitor signal propagation and determine band availability for optimal DX performance.”

Box 7 a: Counting countries
·Track Your Progress: DXCC Countries Worked (Last 3 Months)Stay on top of your performance with the Real-Time DXCC Tracker. This feature provides an instant overview of the unique countries (entities) you have successfully contacted over the past year.
Live QRZ Integration: Syncs directly with your QRZ Logbook to ensure your stats are always accurate and up to date.Dynamic Rolling Count: Automatically calculates the total number of unique countries worked within the last 3months.

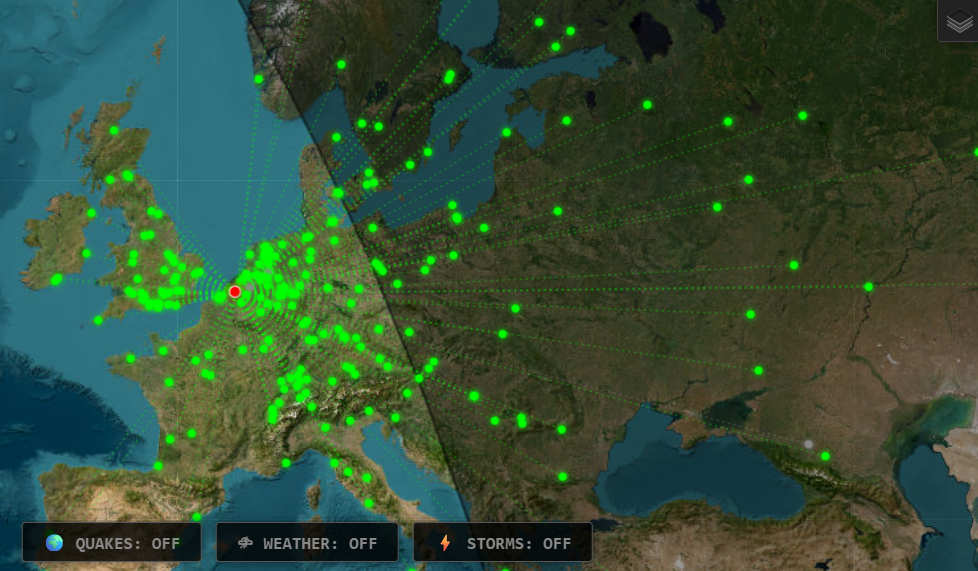
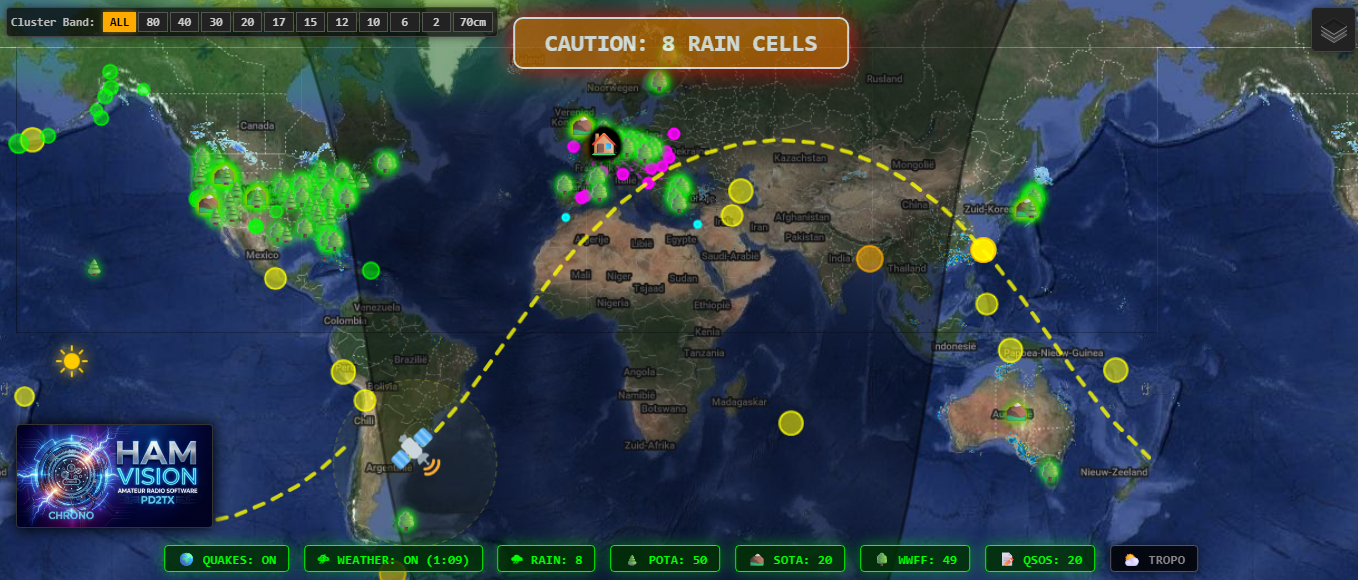
Box 8: Interactive Map View
The Global Map serves as your primary visual command center, offering real-time tracking of satellites, weather systems, and seismic activity.Map Configuration Menu
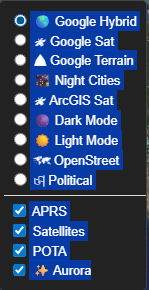
In the top-right corner of the map, click the Layer Icon (double arrow) to open the configuration menu. From here, you can customize your view:
· Map Types: Choose from four distinct layouts to suit your lighting or detail needs: Satellite, Dark, Light, Street or others.
· Feature Toggles: Use the checkboxes to enable or disable the display of APRS (Automatic Packet Reporting System) data and Satellite orbital paths.
Dynamic Environmental Overlays
At the bottom of the map, you will find three specialized toggle buttons. These buttons appear gray when inactive and turn vibrant green when enabled:
· Quakes: Displays real-time data and epicenters of registered earthquakes worldwide.
· Weather: Overlays active weather cells and atmospheric patterns across the globe.
· Rain: Activates high-resolution precipitation tracking. Localized Weather Alerts & thunder tracking
The system includes an intelligent alert system centered on your specific location:
· Station Perimeter: A 50 km radius circle is displayed around your station.
· Rain Alerts: If precipitation enters this 50 km zone, an orange alert box will appear on your screen to notify you of active rain in your immediate area.
· Thunder Warning: When lightning or thunderstorm activity is detected, the Rain button will transition from green to red, providing an immediate visual warning of
severe weather.
· Pota: When this is enabled, clicking on a tree icon will display information about the POTA station.
· Sota: When this is enabled, clicking on a tree icon will display information about the SOTA station.
· WWFF: When this is enabled, clicking on a tree icon will display information about the WWFF station.
· QSO’s: View your most recent activity under the ‘Latest QSOs’ section. You can customize the number of visible contacts in your settings, from 1 up to 200.
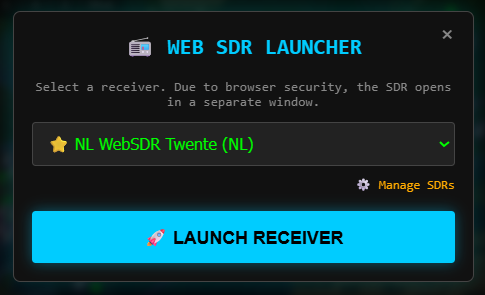
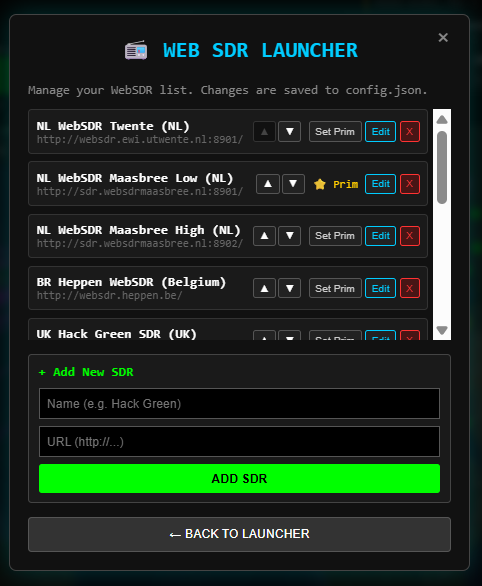
· WEBSDR: By clicking on WebSDR, you can sync directly with the DX Cluster. Simply click on a station in the cluster, and your preferred WebSDR will automatically open at the correct frequency and mode. To manage your settings, click the gear icon to add, remove, or rearrange your favorite WebSDR stations.
Understanding the Analemma
If you were to record the position of the Sun at the exact same time every day for an entire year, the points would form a distinctive figure-eight pattern in the sky. This curve is called an Analemma.
Why does it form an “8”?
The shape of the analemma is caused by two primary factors of our planet’s movement:
Earth’s Axial Tilt ($23.5^\circ$): Because the Earth is tilted, the Sun appears higher in the sky during summer and lower during winter. This creates the vertical length of the figure eight.
Elliptical Orbit: Earth does not travel around the Sun in a perfect circle. Our orbital speed varies—moving faster when we are closer to the Sun and slower when farther away. This causes “Solar Time” to either lead or lag behind our consistent “Clock Time,” creating the horizontal width of the pattern.
The Equation of Time
The horizontal displacement shown in the analemma is known as the Equation of Time. It represents the difference between
Apparent Solar Time (what a sundial shows) and Mean Solar Time (what your watch shows). At different points in the year, the Sun can be up to 16 minutes “fast” or 14 minutes “slow.”
Analemma in HamVision Chrono
In our software, the analemma helps you visualize:
Solar Declination: The Sun’s latitude at noon.
Seasonal Transitions: Clearly identifying Solstices (top and bottom) and Equinoxes (near the crossing point).
Propagation Planning: Understanding solar position is key for predicting gray-line propagation and signal paths.
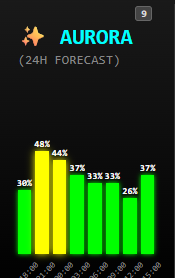
Box 9: Aurora 24-Hour Forecast
· What it is: This panel provides a 24-hour lookahead at the likelihood of auroral activity.
· Why it matters for Hams: * VHF/UHF Fun: Strong auroras create a “radio mirror, allowing for Auroral Backscatter—a unique way to bounce signals o the aurora to make distant contacts.
o HF Warning: A high aurora forecast often means HF propagation might be disrupted or “fluttery” due to ionospheric disturbances.
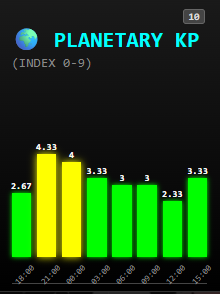
Box 10: Planetary Kp Index (Scale 1–9)
· What it is: The “Planetary K-index” is a 3-hour average of Earth’s magnetic field stability, measured on a scale from 0 (Quiet) to 9 (Extreme Storm).
· How to read it:
o Kp 0–3: Green light! The magnetic field is stable, generally meaning great conditions for HF DXing.
o Kp 4: “Unsettled” – you might notice some signal fading.
o Kp 5 or higher: Red light! We’ve hit “Storm” levels (G1–G5). While this is bad for standard HF, it’s the “Magic Moment” for Aurora hunter
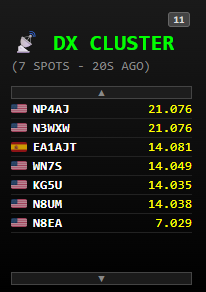
Box 11: DX Cluster
The DX Cluster module provides a live feed of global station activity, allowing you to identify active DX stations and their frequencies in near real-time. Live Spot Activity
· Real-Time Updates: The list refreshes automatically to show the most recent “spots,” including the station’s callsign, country flag, and exact frequency (e.g., 14.081 MHz).
· Timestamping: The header displays the total number of spots and how recently the data was updated (e.g., 20s AGO).